
Let's look at which regions travellers are coming from, in other words, the generating regions.
Look at some infographics below based on data from the UNTWO 2019 report.
Sub Topics

Outbound Tourism by Region of Origin (% share)
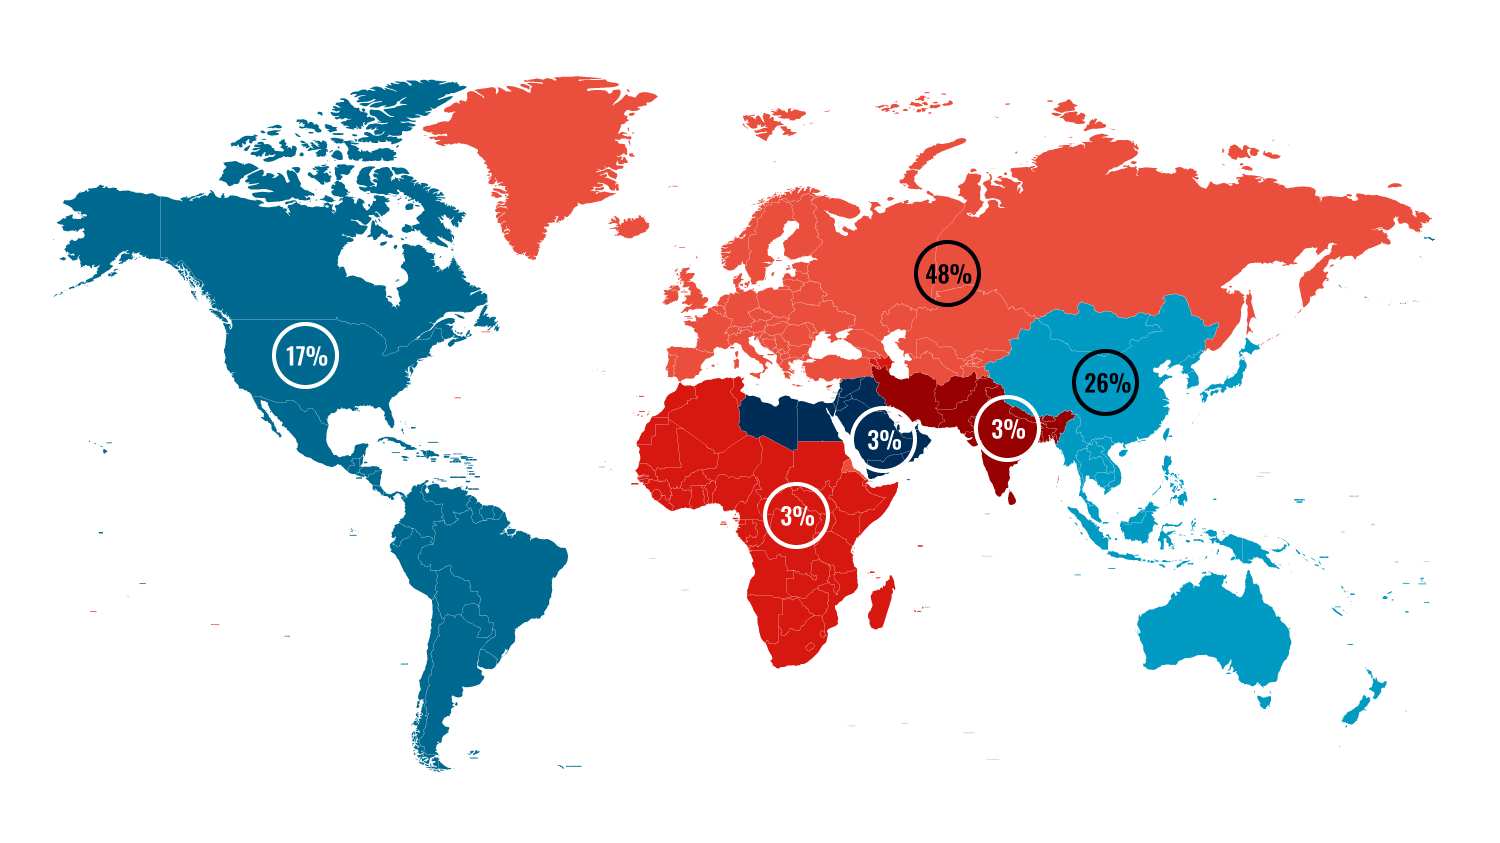
4 out of 5 tourists travel within their own region.
| REGIONS GENERATING TOURISTS (in millions) | 2015 | 2016 | 2017 | 2018 | %change 2017/2018 | %share of world in 2018 |
|---|---|---|---|---|---|---|
| Africa | 36 | 39.6 | 42.5 | 45.5 | 6.6 | 3.2 |
| Asia/Pacific | 293.6 | 314.4 | 337.6 | 358.7 | 5.9 | 25.6 |
| Americas | 200.2 | 211.6 | 227.3 | 235 | 3.3 | 16.8 |
| Middle East | 39.7 | 36.3 | 36.8 | 40.6 | 9.4 | 2.9 |
| Europe | 581.8 | 592.8 | 636.6 | 672.3 | 5.4 | 48.0 |
Module Linking